Guides
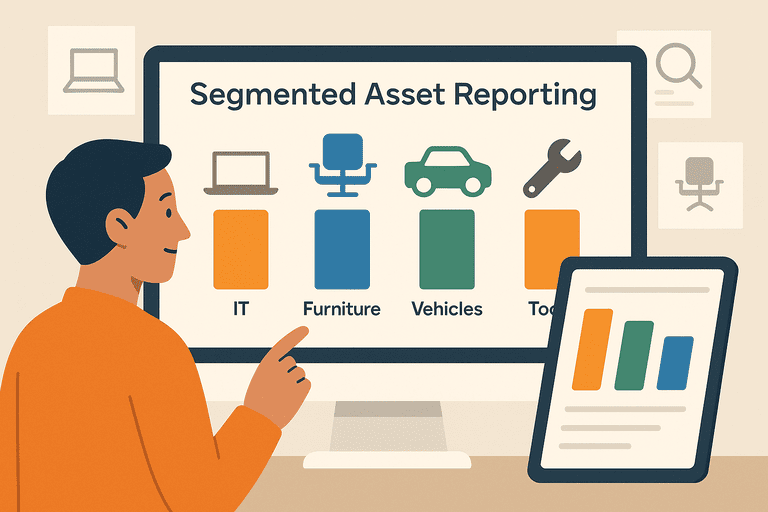
Asset Class Segmentation for Reporting: A Practical Guide
How to segment asset classes for cleaner reporting, simpler audits, and more consistent category data across IT, operations, and finance.
TL;DR
- Keep the category hierarchy short and stable, then put owner, location, and status in separate fields.
- Use categories to support reporting decisions, not to describe every asset detail.
- Review category sprawl quarterly before duplicate labels distort audit and finance rollups.
Turn broad segmentation intent into a practical reporting model tied to category hygiene, audits, and finance-ready structure.
- Inventory Audits & Compliance Hub · hub overview
- IT Asset Audit Checklist: 60-Minute Runbook for Teams · related article
- Inventory and Accounting Integration Without ERP for Teams · related article
- Bridging Physical and Digital Audits with QR Checks · related article
Audience: IT, operations, and finance-adjacent teams cleaning up asset categories and rollup reporting
Asset Inventory Audit Checklist · guide
Custom Fields · feature page
Learn how to segment asset classes for cleaner reporting, simpler audits, and more consistent decision-making across IT, operations, and finance.
Introduction
If your asset reports are inconsistent, the problem is often not the report itself. It is the category structure underneath it.
Teams usually start with broad labels such as IT, Furniture, or Tools, then add exceptions over time. The result is predictable: duplicate categories, mismatched rollups, and reports that are hard to trust.
This guide explains how to segment asset classes for reporting without overbuilding the taxonomy. It is written for teams that need cleaner operational reporting first, with enough structure to support audit and finance workflows later.
If you need the broader lifecycle context around status changes, maintenance, and retirement, see the Asset Lifecycle Management Hub.
TL;DR
- Segment assets based on the reporting decisions you need to make, not every possible attribute.
- Start with a short, controlled hierarchy such as
IT Equipment -> Laptopsand keep assignment or status in separate fields. - Keep category names fixed, use separate fields for owner and location, and review category hygiene quarterly.
A Simple Reporting Model
Use the smallest category model that still answers your core reporting questions.
| Reporting need | Segment by | Separate fields to keep | What to avoid |
|---|---|---|---|
| Device ownership and audits | Asset class and subcategory | Assignee, location, status | Putting user names inside category labels |
| Replacement planning | Asset class and age band | Purchase date, warranty, condition | Creating a new category for every model |
| Finance rollups | Asset class and accounting mapping | Cost center, depreciation class | Mixing operational and accounting names in one field |
| Shared equipment usage | Asset class and checkout type | Custodian, availability, return status | Splitting identical assets into separate classes by team nickname |
For many small IT teams, a two-level hierarchy is enough:
IT Equipment -> LaptopsIT Equipment -> MonitorsIT Equipment -> PeripheralsShared Equipment -> Loaners
That structure is usually more useful than a long list of inconsistent labels.
1. What Asset Class Segmentation Actually Means
Asset class segmentation means grouping assets in a way that supports consistent reporting.
In practice, that usually means separating:
- what the asset is
- who uses it
- where it is
- what state it is in
Only the first item should usually live in the category hierarchy.
The other attributes should sit in separate fields. If you mix them together, reporting becomes fragile fast.
Bad example:
Laptop - Marketing - Berlin - Broken
Better example:
- Asset class:
IT Equipment -> Laptops - Department:
Marketing - Location:
Berlin - Status:
Needs repair
If your current structure lives in spreadsheets, the usual failure mode is naming drift and missing field discipline; this is the broader context: Why Spreadsheets Don’t Work for Asset Tracking (And What to Use Instead).
2. Choose the Reporting Outcome First
Before you create or rename categories, decide what the reporting output must answer.
Common reporting outcomes include:
- how many assets each team owns
- what is due for refresh in the next two quarters
- where audit mismatches are happening
- which classes generate the most maintenance work
- what categories finance needs for depreciation or capitalization
If a category does not improve one of those outputs, it is probably unnecessary.
This is the main design rule: categories exist to support decisions, not to describe every detail of the asset.
3. Build a Stable Hierarchy
A practical hierarchy usually has two or three levels.
Option A: Small-team operational hierarchy
IT EquipmentShared EquipmentNetwork EquipmentOffice Equipment
Under those, add controlled subcategories such as:
LaptopsMonitorsDocking StationsAccess PointsPrinters
Option B: Reporting plus finance mapping
Use the same operational classes, then map them to separate finance fields such as:
- depreciation class
- capitalization rule
- cost center
- useful life band
This keeps operational reporting readable while still supporting accounting workflows.
If you need additional structure without turning category notes into free text, use custom fields.
4. Keep Owner, Location, and Status Out of the Category Name
This is where most reporting systems go wrong.
When category names absorb location or ownership, you lose the ability to roll up reports cleanly.
Use this separation:
| Field | Example | Why it matters |
|---|---|---|
| Asset class | IT Equipment -> Laptops | Gives stable reporting rollups |
| Assignee or custodian | A. Ivanov | Supports accountability |
| Location | Belgrade office | Supports audits and move planning |
| Status | Active, Loaned, Repair, Retired | Supports workflow and exceptions |
| Cost center | Engineering | Supports finance reporting |
If you need a verification routine to keep those fields clean, start here: IT Asset Audit Checklist (for Small IT Teams).
5. A Practical Segmentation Workflow
Use this sequence when cleaning up an existing register.
Step 1: Export the current list
Pull the asset register and list every unique category name currently in use.
Step 2: Group near-duplicates
Typical examples:
LaptopLaptopsLaptop deviceAssigned laptop
Those should usually collapse into one subcategory.
Step 3: Define the master hierarchy
Keep it short and publish it internally.
Step 4: Move detail into fields
Relocate owner, status, office, and cost-center detail into separate fields.
Step 5: Reconcile exceptions
Create a short exception list for items that do not fit the new structure rather than creating ad hoc categories immediately.
Step 6: Review quarterly
Category sprawl comes back unless someone checks it. A 15-minute quarterly review is usually enough.
6. Reporting Examples That Actually Matter
Here are the reports most teams can produce once segmentation is stable.
| Report | Needed fields | Typical decision |
|---|---|---|
| Devices by class and assignee | Asset class, assignee, location | Ownership cleanup and audit prep |
| Refresh pipeline by class | Asset class, purchase date, condition | Budget planning |
| Maintenance volume by class | Asset class, repair status, notes | Replace vs repair review |
| Shared equipment usage by type | Asset class, checkout status, custodian | Reservation and availability planning |
If your goal is cleaner reporting rather than deeper operational analysis, keep the model simple. Complexity should be earned by a reporting need.
7. Common Segmentation Mistakes
Building too many classes too early
Most teams do not need separate classes for every vendor or model.
Mixing reporting logic
Do not use one field to serve category, accounting, and workflow status at the same time.
Leaving naming open-ended
Free-text categories guarantee duplicates.
Treating cleanup as a one-time task
A clean hierarchy degrades unless it is reviewed.
To keep segmented reporting accurate over time, run lightweight audits to reconcile category, location, and ownership fields: Inventory Audit Checklist: What to Verify and How Often.
8. When to Add More Detail
Add depth only when the current model cannot answer a real reporting question.
Examples:
- Split
IT Equipment -> LaptopsintoStandardandHigh-speconly if budgeting or lifecycle policy depends on that distinction. - Split
Shared Equipmentby checkout type only if scheduling and accountability differ materially. - Add finance mappings only when accounting reports actually need them.
That approach keeps the hierarchy usable for operations while still supporting deeper reporting later.
Conclusion
Good asset segmentation is not about building a perfect taxonomy. It is about creating a stable structure that supports consistent reporting.
Start with a small hierarchy, keep owner and location data in separate fields, and review the structure before it drifts again. That is enough to improve reporting quality for most teams without turning the register into a classification project.
FAQ
How many asset classes should a small IT team start with?
Usually four to eight top-level classes are enough. The more important decision is whether subcategories are consistent and tied to reporting needs.
Should location be part of the asset class?
Usually no. Location should be a separate field so you can move assets without breaking reporting consistency.
What is the difference between an asset class and an asset status?
The asset class describes what the item is. Status describes its current state, such as active, checked out, under repair, or retired.
Methodology
- This guide was reviewed as a reporting-structure page for teams that need cleaner asset classes, more reliable rollups, and less naming drift across operational and finance-adjacent workflows.
- Recommendations are intentionally conservative and favor a small, controlled hierarchy over broad taxonomy design.
References
- CIS Critical Security Control 1: Inventory and Control of Enterprise Assets · Center for Internet Security
- NIST SP 800-171 Rev. 3 · NIST
FAQ
Should location be part of the asset class?
Usually no. Location should stay in its own field so the asset can move without breaking reporting consistency or creating duplicate categories.
How deep should an asset category hierarchy be?
For most teams, two or three levels are enough. More depth only helps when it supports a real reporting decision such as refresh planning, audit rollups, or finance mapping.
What is the main sign that segmentation needs cleanup?
The clearest sign is duplicate category logic: similar assets appearing under different labels because owner, location, or status leaked into the category name.
Try InvyMate
Start tracking assets with QR codes and scheduled audits.